


May 25, 2023
AARRR Pirate Metrics Framework Explanation
Ahoy there! If you’re a savvy business owner or marketer, you may have heard of the AARRR Pirate Metrics framework. No, it’s not a guide on how to raid and plunder ships on the high seas. It’s a powerful tool for measuring and optimizing the success of your business.
The AARRR framework breaks down your customer’s journey into five key stages: Acquisition, Activation, Retention, Referral, and Revenue. This article will explore each and explain how to use AARRR to improve your bottom line.
Today, Artkai, a cutting-edge digital product development agency, will discuss some of our successful projects, including a FinTech solution for the travel industry, an intelligent payment ecosystem, and a SaaS platform for digital advertising. Taking them as examples, we’ll show you how to unlock the full potential of AARRR.
What Is AARRR Pirate Metrics Framework?
The AARRR Pirate Metrics framework is an acronym for five sets of metrics for measuring the business’s growth and success: Acquisition, Activation, Retention, Referral, and Revenue. Its creator, venture capitalist and entrepreneur Dave McClure, suggested that a startup must go through these key stages to achieve sustainable growth. Let’s quickly review them:
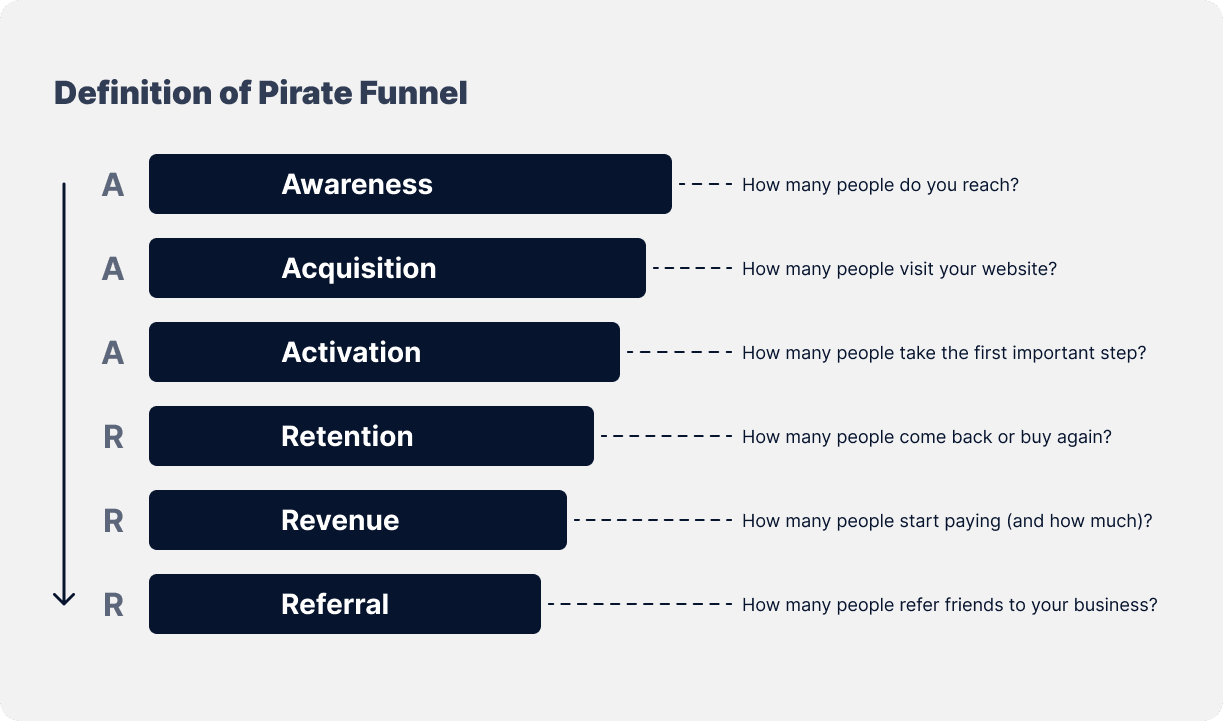
- Acquisition — focuses on attracting new customers to your business and helps discover where they are coming from.
- Activation — concentrates on prompting your customers to take action and engage with your product or service.
- Retention — concerns about keeping your customers interested and returning for more.
- Referral — encourages customers to recommend your products or services to others.
- Revenue — focuses on turning your potential clients into paying customers.
But why the name “Pirate Metrics”? It’s not that McClure believed that businesses must be scrappy and cunning. Just say “AARRR” out loud — that funny pronunciation is the answer.
What Metrics Does the AARRR Pirate Framework Contain?
Now that we’ve introduced the AARRR framework and its five stages, let’s look at the metrics that make up each. Understanding them will help you gain valuable insight into your business’s performance and identify areas for improvement.
Acquisition
The first stage of the AARRR model, Acquisition, explains how people find your business and how you can turn them into your customers. This “A” is about getting your target audience to notice you and take the first step toward engaging with your product or service.
What do you need to do at this point? First and foremost, identify your customers, i.e., create specific user/buyer personas. Also, determine the marketing channels most relevant for your target audience. They may include:
- Search engines
- Social media
- Advertising and marketing campaigns
Now, let’s discuss some metrics helpful in customer acquisition. Some of the most common include:
- Website traffic — measures the number of visitors to your site, helping you understand how effectively your marketing efforts drive people to your website.
- Organic search traffic — measures the number of visitors to your website who found you through a search engine like Google.
- Cost per click (CPC) — measures how much it costs to get someone to click on your ad.
- Customer acquisition cost (CAC) — measures how much money you spend to acquire a single customer.
- Conversion rate — measures the percentage of people who land on your website and take a desired action.
Tracking Acquisition metrics allows you to gather a sustainable customer base and set the stage for long-term growth.
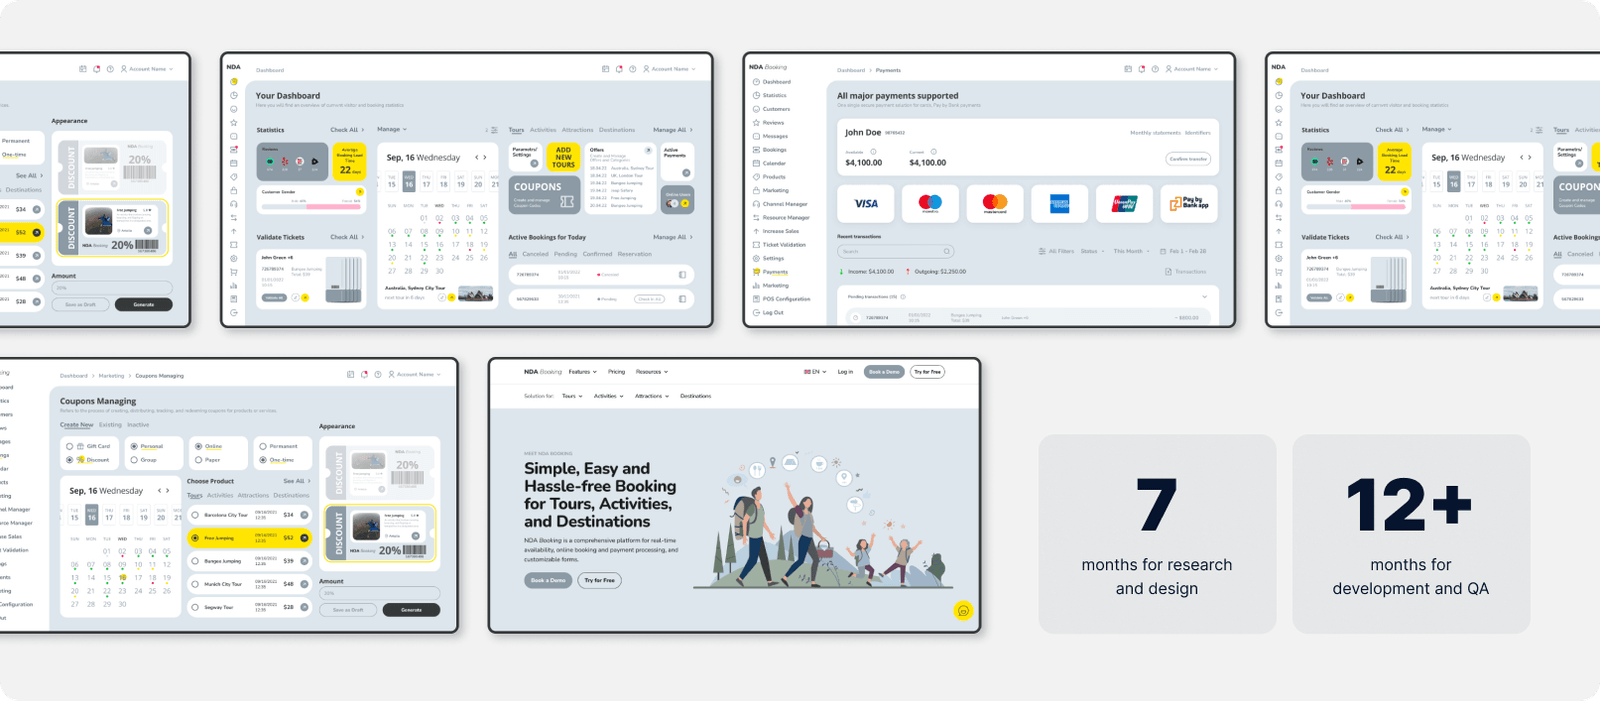
Delivering a Universal Solution for the Travel Industry
See how we applied the AARRR metrics framework in our project for a travel industry client. Our team designed a booking platform, developed inventory management and CRM tools, and built integrations with top online travel agencies (OTAs) to draw more customers.
Using the AARRR funnel, we focused on customer acquisition, activation, and retention to drive business growth. As a result, over 200 B2B providers joined the platform designed by Artkai, and since its launch, more than 10,000 bookings have been made. On top of that, our client had a 30% increase in revenue.
Activation
The Activation stage is the customer’s first impression of your product or service. It’s when you initiate the relationship with your users and try to create a positive experience that encourages them to continue engaging with your business. It’s also when your customers realize the value of your products or services, aka reach the “AHA” moment.
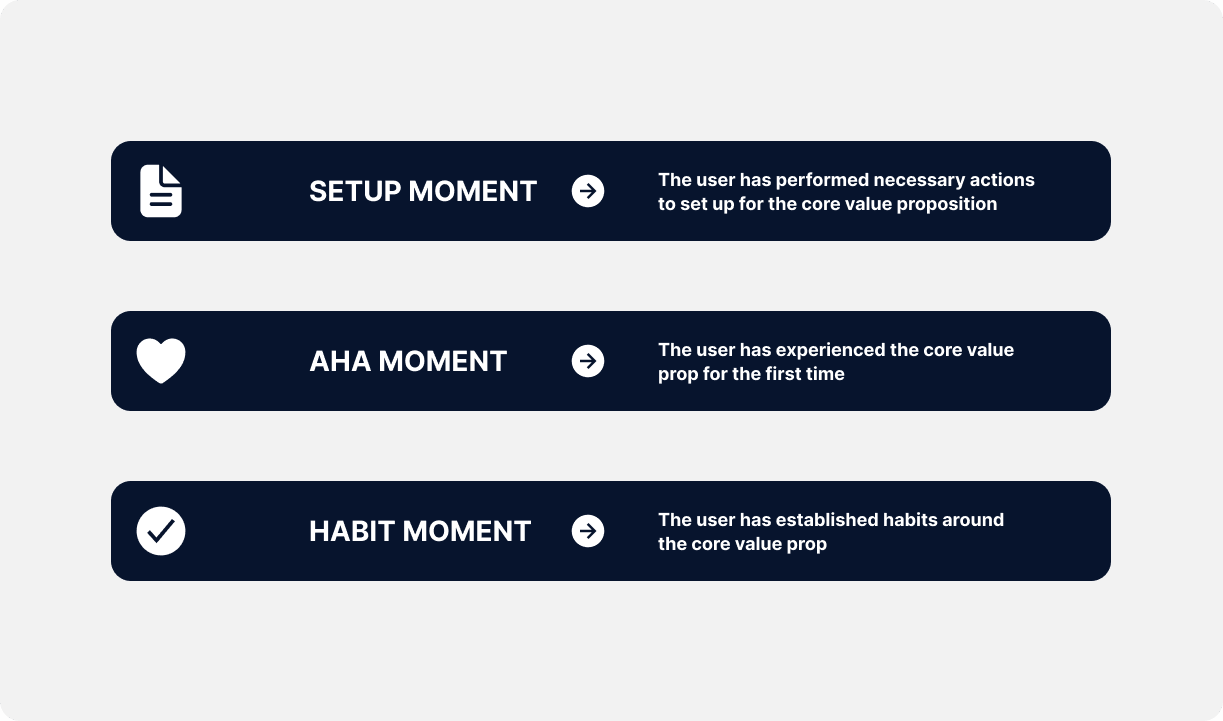
What’s critical at this point is determining the “AHA” moment itself. Naturally, it will be different for various user personas as they have their individual journeys with your business. Yet, you can gather customer feedback and outline several valuable activation moments.
Once you have those outlined, you may track the following activation-stage metrics:
- Account creation — measures the number of new user accounts created on your platform, representing the first step toward user engagement.
- Onboarding completion rate — measures the percentage of users who complete the onboarding process after creating an account.
- Activation rate — measures the number of users who reached the “AHA” moment vs. those who have just signed up.
- Time-to-first action — measures the time it takes for a new user to take action representing an engagement with your product or service.
- Conversion rate — measures the percentage of users who complete a specific action, like signing up for a trial.
Creating a SaaS Platform for Digital Advertising
In product management terms of activation, Artkai has successfully created a SaaS platform for a digital advertising client. It connected multiple advertising platforms, tracked expenses, and streamlined document flow. The soft launch with a limited number of users ensured everything was working correctly before making the tool available to the public.
Since then, the platform’s user base, number of vendors, and funds spent on ad campaigns have consistently grown. With 685 users and over 3,000 tasks completed monthly, the platform has helped clients automate their advertising processes and streamline their operations.

Retention
Another stage critical in your product development strategy is Retention. It’s all about keeping your existing customers engaged, which is often more cost-effective than acquiring new ones. In addition, satisfied clients are more likely to recommend your products/services to others, ultimately increasing your revenue.
As you can see, a high retention rate brings numerous benefits to your business. But how to keep it high? Consider the following tips:
- Pay increased attention to personalization
- Highlight the advantages of your product or service but not the features
- Send emails following your customers’ behavior or habits
- Think of adding powerful CTAs
- Implement loyalty programs, rewards, or exclusive benefits for your existing customers
- Deliver excellent customer support by promptly addressing inquiries and issues
Let’s now go through the metrics you can track at the Retention stage.
- Retention rate — measures the percentage of customers who keep using your product or service over a specific period.
- Churn rate — measures the percentage of customers who stop using your product or service within a specific period.
- Active user rate — measures the percentage of users who engage with your product or service regularly (daily, weekly, etc.).
- Net promoter score — measures the probability a user will recommend your product/service to others on a scale of 0 to 10.
- Repeat visits — measures how frequently a user returns to your product within a specific time frame.
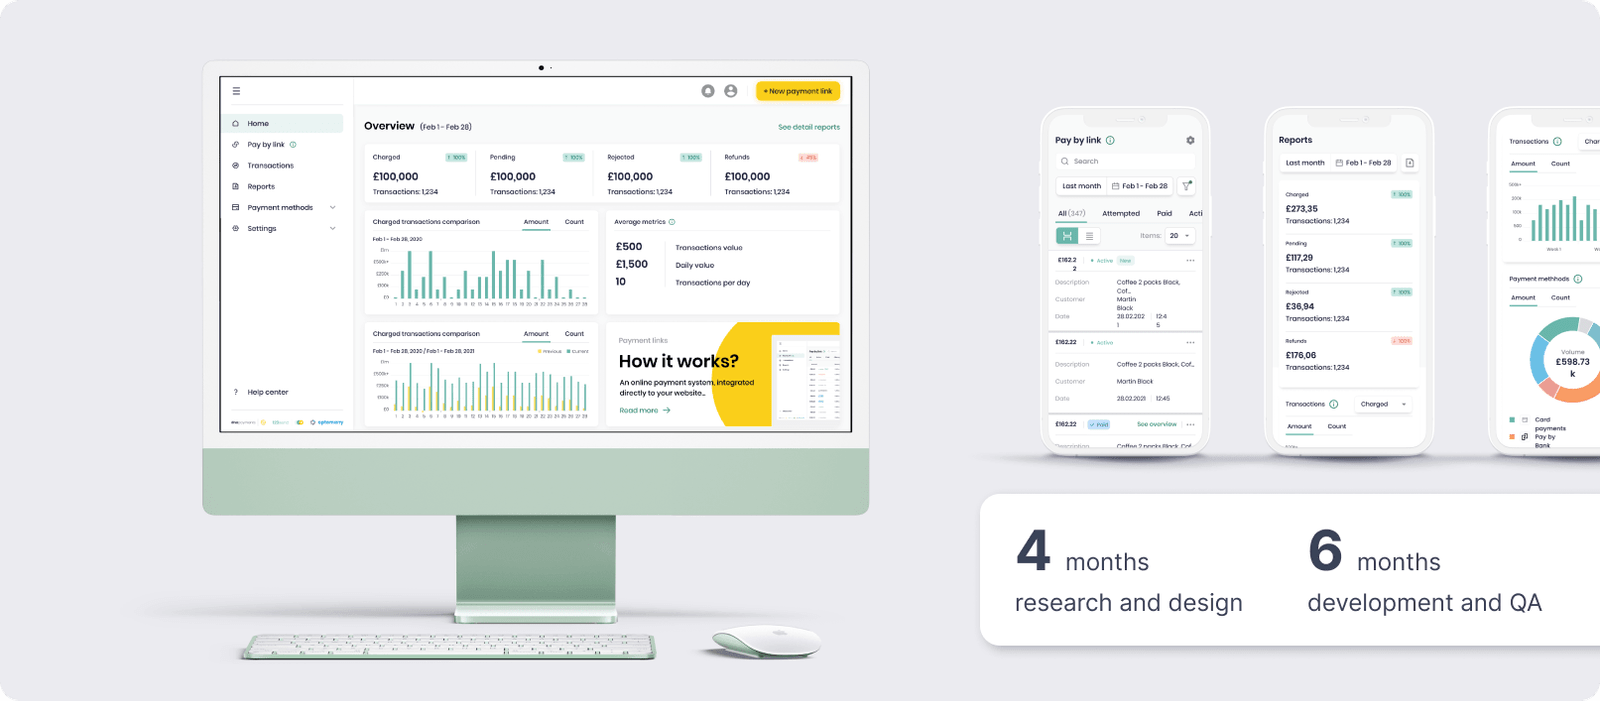
Building an Intelligent Payment Ecosystem
DNA Payments’ project is an excellent example of how focusing on user experience and retention can propel company growth. This client approached Artkai to redesign their portal and create an onboarding process, a mobile version of the platform, and the missing components to provide a seamless user experience across devices.
Our redesign services led to an 18% increase in new users during the first several months after launch and a 2.3x decrease in churn rate during the first two weeks. On top of that, DNA Payments now serves over 65,000 merchants, processing £900,000,000 monthly with 100,000 terminals and checkout pages, making it the 4th largest payment provider in the UK.
Referral
The Referral stage of the AARRR metrics framework is all about determining whether your customers will recommend your business to their social circle, and finding ways to motivate them to do so. Referral marketing can be effective in driving growth as it relies on the power of word-of-mouth recommendations from satisfied users.
At this stage, you should study positive and negative feedback about your products or services on:
- Social media
- Review websites
- Industry-specific forums and communities
Getting positive word of mouth from your customers organically is also fundamental to your business. However, not every person will be willing to leave feedback about your products and services. But don’t worry; you can give your customers additional push in the following ways:
- Introducing referral programs
- Integrating social sharing buttons or widgets
- Publishing user-generated content
- Posting helpful content to solve customers’ pain points
What AARRR metrics can you track at the Referral stage?
- Referral rate — measures the percentage of customers who refer others to your product or service.
- Viral coefficient — measures the number of new customers each existing customer refers to on average.
- Referral revenue — measures the revenue generated by users referred to your product or service.
- Referral ROI — measures the return on investment of your referral program.
- Referral conversion rate — measures the percentage of referred users who become paying customers.
- Referral engagement — measures the engagement level of referred visitors to your product or service.
The above will assist you in studying the effectiveness of your referral strategy. For instance, if you find out your referral rate is low, you likely need to improve your incentives or messaging efforts. The same applies to the viral coefficient — you may need to enhance the user experience or add new features to encourage viral sharing.
Revenue
The Revenue metrics stage of the Pirate funnel focuses on the financial performance of your product or service. At this point, you do everything to optimize your revenue streams and increase your business’s profitability.
These are the essential Revenue metrics you may want to check:
- Customer lifetime value (CLV) — measures the total revenue each customer generates throughout their relationship with your business.
- Customer acquisition cost — measures the cost of attracting a new customer.
- Average revenue per user (ARPU) — measures the average earnings generated by each user.
- Gross revenue — measures the total income generated by your product or service without factoring in any costs or expenses.
- Net revenue — measures the profits from your product or service after factoring in all costs and expenses.
In practice, tracking Revenue metrics helps identify areas in earlier stages of the customer journey that need revision. For example, if your CLV is low, you may need to focus on improving retention and loyalty among your target audience.
All the stages of Pirate Metrics AARRR (Acquisition Activation Retention Referral Revenue) ultimately lead you to insight-driven decisions about your business, services, and products and simultaneously improve customer experience.
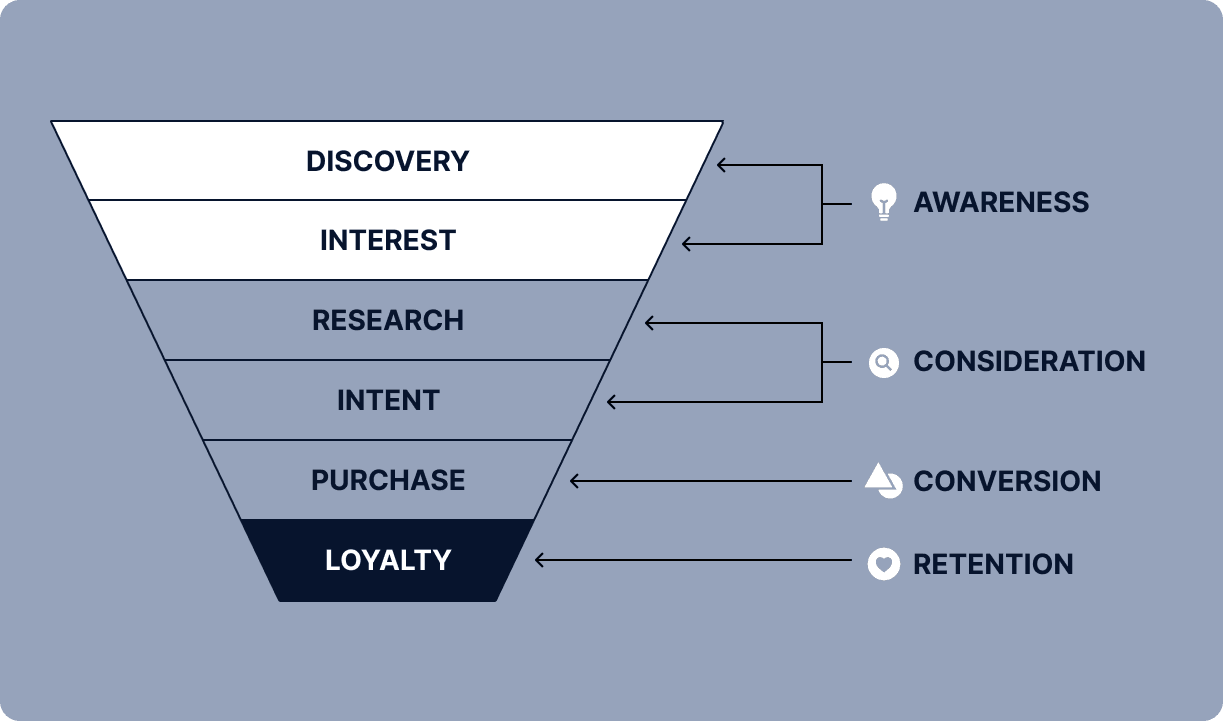
AARRR vs. RARRA — Which One to Choose?
As you know, the AARRR framework helps measure business success by studying various aspects of your customer’s journey. Yet, if you’re looking for more options to track your success, discover another funnel — RARRA.
RARRA is almost the Pirate Metrics, with some stages swapping their places: Reach, Activate, Revenue, Retain, and Advocacy. While both frameworks focus on similar metrics, some key differences may make one more suitable for a particular business.
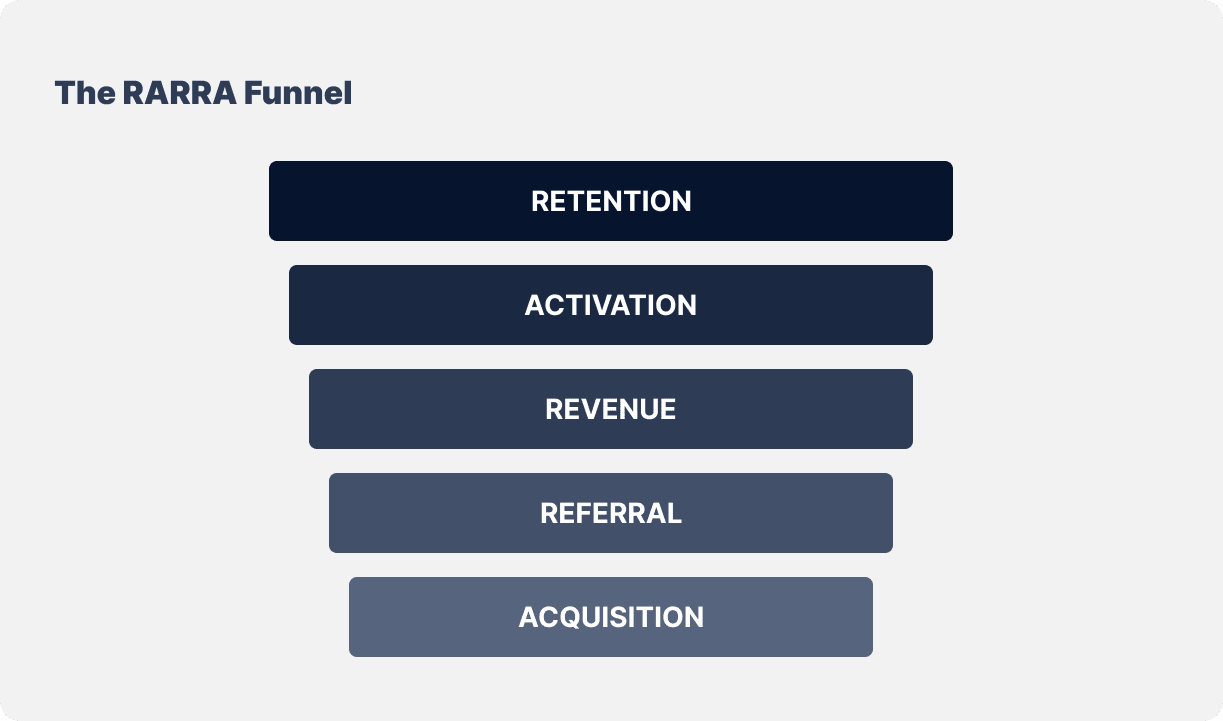
The AARRR model is focused on the customer journey, starting with acquiring customers and moving them through the stages until they become loyal clients. It is well-suited for startups and early-stage companies, providing a clear growth and optimization roadmap. RARRA, on the other hand, works better for established businesses with a solid customer base looking to expand their reach and increase revenue.
Thus, choosing the best option to measure your company’s growth largely depends on your goals and business stage.
Conclusion
The AARRR product metrics framework offers a versatile set of metrics to track and enhance at each customer journey stage. Using it, you can improve your profitability, achieve stable growth, and improve customer experience.
At Artkai, we have profound expertise in product design and development. Our team of experts can assist you in enhancing your product strategy, ultimately helping you boost your AARRR metrics and maximize your company’s potential.
If you want to learn more about how AARRR can benefit your product, check out our product strategy consulting services. Or simply contact our team to discuss your project right away.
Clients and Results
Schedule your free consultation
Don't miss this opportunity to explore the best path for your product. We are ready to delve into the specifics of your project, providing you with expert insights and optimal solutions.
Book your free sessionWhat is the significance of the AARRR metrics framework?
The AARRR metrics framework’s significance lies in providing a comprehensive set of metrics to measure the various stages of a customer’s journey. By tracking these stages, which include Acquisition, Activation, Retention, Referral, and Revenue, businesses can gain insights into the effectiveness of their marketing and sales efforts, customer engagement, and growth potential.
How can the AARRR framework be applied to improve business performance?
Businesses can leverage the AARRR model to identify areas for improvement and make data-driven decisions. By studying the metrics at each stage, they can optimize their acquisition strategies, enhance user activation and onboarding experiences, increase customer retention and loyalty, leverage referrals to expand their customer base, and boost revenues.
What are some examples of metrics that can be used for each stage of the AARRR framework?
For Acquisition, businesses can track metrics like website traffic, customer acquisition cost, or conversion rate. Activation metrics may include account creation, onboarding completion rate, and time-to-first action. Retention metrics can involve measuring customer churn and retention rates, repeat visits, or net promoter scores. For Referral, companies can track referral conversion rate, referral revenue, and viral coefficient. Finally, Revenue metrics may include customer lifetime value, average revenue per user, and gross/net revenues.
How frequently should businesses measure and analyze the AARRR metrics?
The frequency of measuring and analyzing the AARRR metrics depends on the nature of the business, its goals, and the specific metrics tracked. We recommend monitoring the metrics constantly to gain real-time insights and make timely adjustments. Nevertheless, companies can also set regular intervals, such as monthly or quarterly, to conduct in-depth analyses and evaluate their performance.
Read More
Explore articles from Artkai - we have lots of stories to tell
Join us to do the best work of your life
Together we advance the human experience through design.