


ERP system for solar energy management
Covering all the aspects of renewable energy projects in one place.
OVERVIEW
About the business
Artkai team was challenged to build an ERP tool that would tie every aspect of solar energy management together and make the life of owners, investors, and managers easier.
The idea behind the product came up as the solar industry was missing one cohesive solution. There were many products dedicated to solar management, but they all tackled different divisions of it. Users had to interact with different systems: separated instruments for accounting and finances, production monitoring, project management, and task management. These systems didn’t communicate with each other and had a lot of manual data input.
Often users had to create third party documents to transfer data from one system to another. It was perfect timing to present the market with a solution that provided everything in one place.
OVERVIEW
Project tasks
- Build an ERP solution that integrates the core functionality of the tools that users were previously using into a single ecosystem that is logically structured and easy to use.
- Come up with the system architecture of a centralized system to increase efficiencies and enable collaboration.
- Reduce manual-driven processes and provide tools to check operative information and make quick, informed decisions
OVERVIEW
Project team
Team: 2 UI/UX designers, 2 Front-end engineers, 2 Back-end engineers, Solutions Architect, Project manager, Business analysts, DevOps, 3 QA engineers.
6
months for research and UX/UI design
12+
months for web and mobile
development
Design and development are done in parallel after the research and discovery phase.
OVERVIEW
Tech stack

TypeScript

React.js

Redux

Next.js

Node.js

AWS

K8S

PostgresQL

REST

Swagger

Socket.io
Microservices
Redis

Rabbit MQ

GraphQL
Get a quote
or free consultation
PROJECT JOURNEY
Product development
Overview.
Product requirements
Our client wanted to build a full-stack technology platform that would tie all the needs for monitoring, managing, and monetizing users’ renewable assets portfolio. Surprisingly, no products could automatically connect all solar field data and provide a holistic view of how the product impacts the revenue.
The new system was expected to assist managers in making well-grounded decisions in the shortest terms. We had to consider that managers something, not tech-savvy people. This point, in a big way, determined our approach to product design. Our team had to find options to reduce manual input and decrease the number of instruments the energy management team used. We also wanted to make the comparison between projected and actual production metrics visual. It will not be superfluous to mention that the client wanted to have a mobile product version from the start. This request determined a lot of our prioritizing and choice of tech stack.
The approach
To get the job done right, our team started the project by defining and completing the following steps:

Defined main roles and scenarios that should
be performed in the system via Jobs To Be Done framework

Created User Story Map, which served as the base
for the first version of Backlog

Came up with a Design System solution that allowed significantly sped up the design and development phase

Created a Service Blueprint Diagram that allowed
us to design optimized and consistent solutions
for existing Planning and Project Construction workflow

Designed the interface with a flexible module system

Created the BPMN diagram that reflected all the processes inside the system and the interaction
of all participants
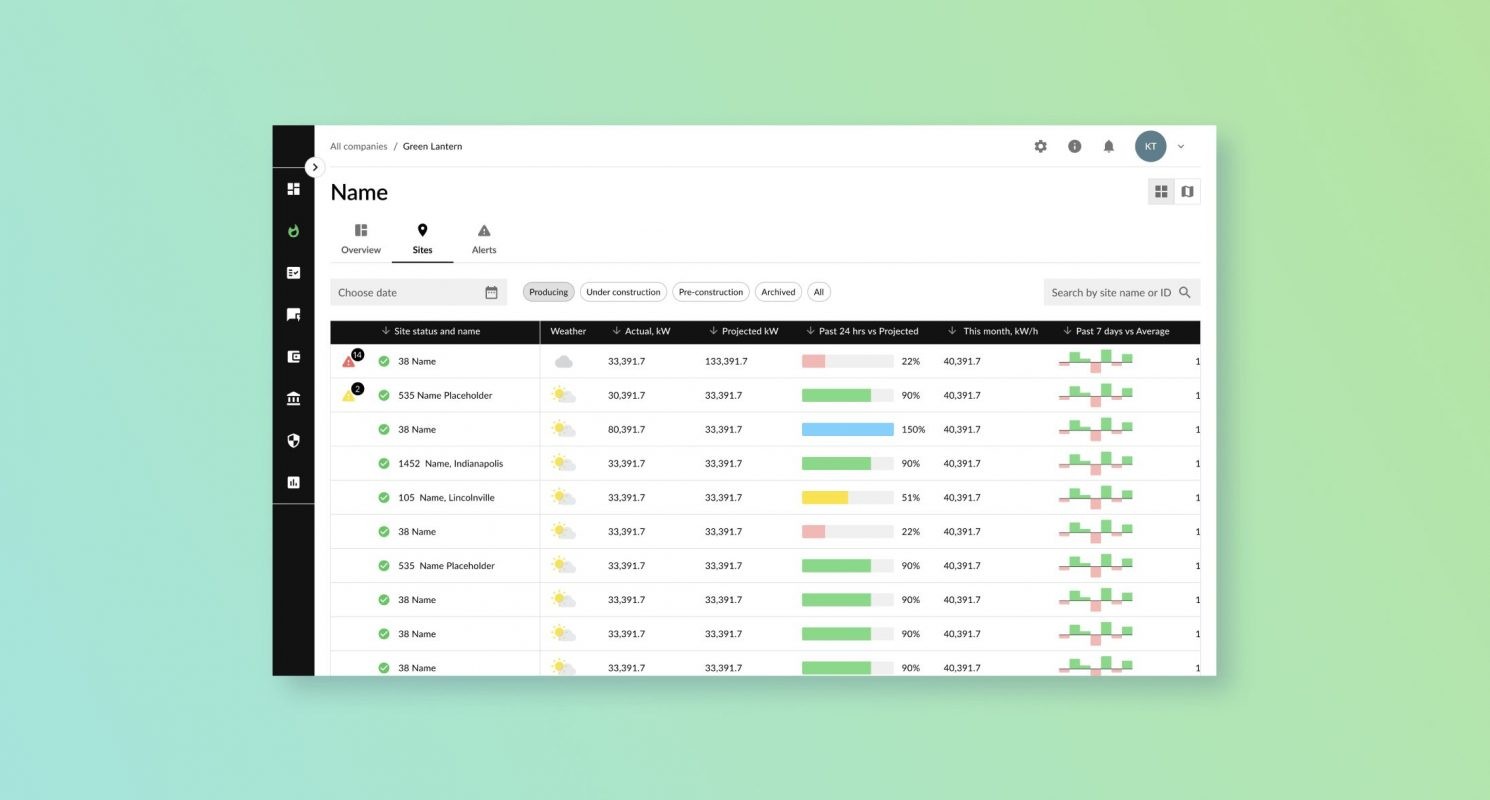
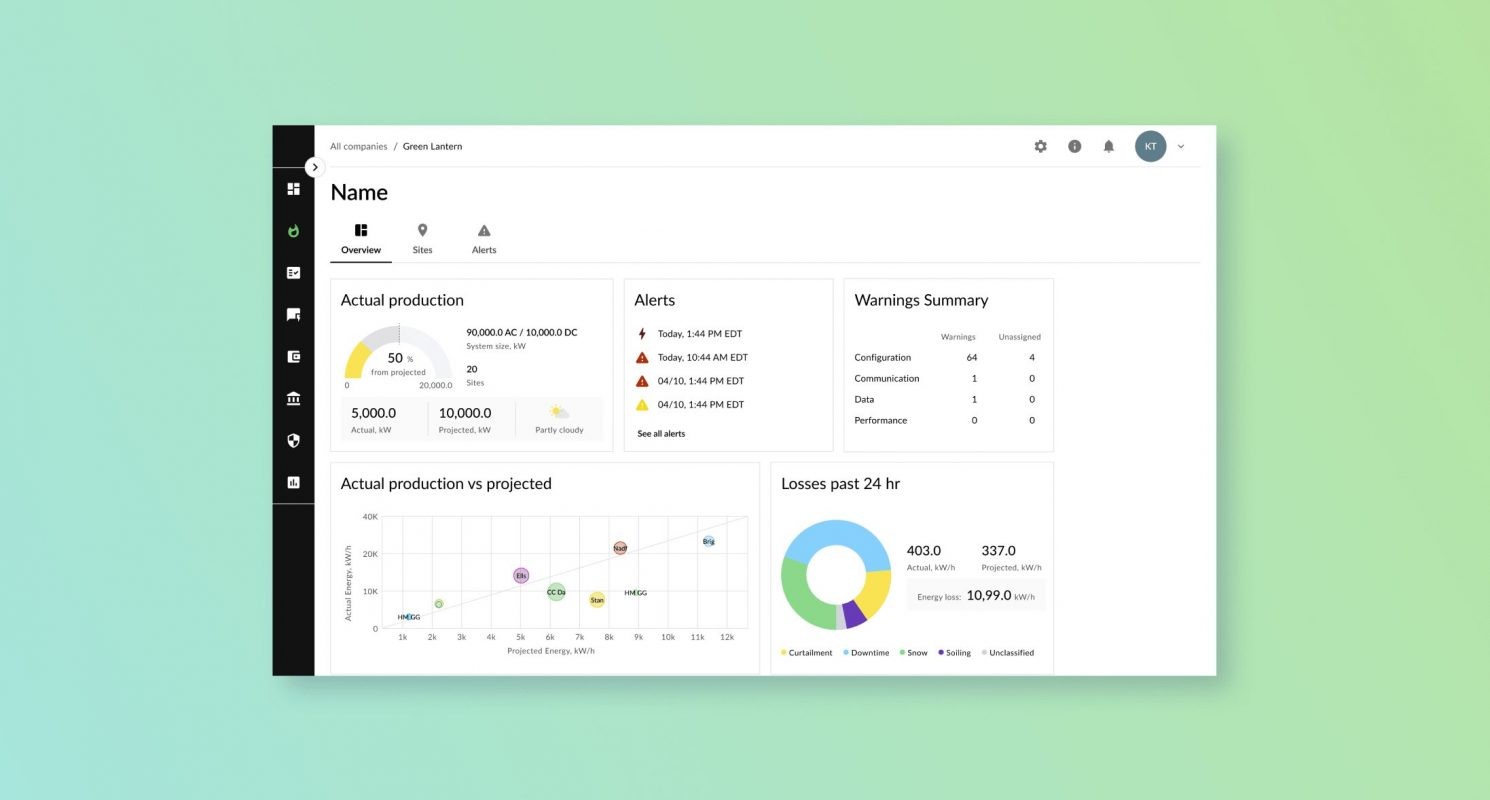
Overview sites.
Tech stack
As we were building a cohesive ERP system, the right choice for the tech stack was mandatory. Our selection fell to the JavaScript stack with React for the front-end, React Native for the mobile app, and Node.js/Nest.js for the back-end. That combination was perfect for developing our real-time system to handle multiple simultaneous requests and processing data from the on-site devices.
While forming the backlog and designing the solution, our team had the vision for further development, and scalability was a must. It's not superfluous to mention that JavaScript-based languages are easy to maintain in the long run and cost-effective in development and operation.
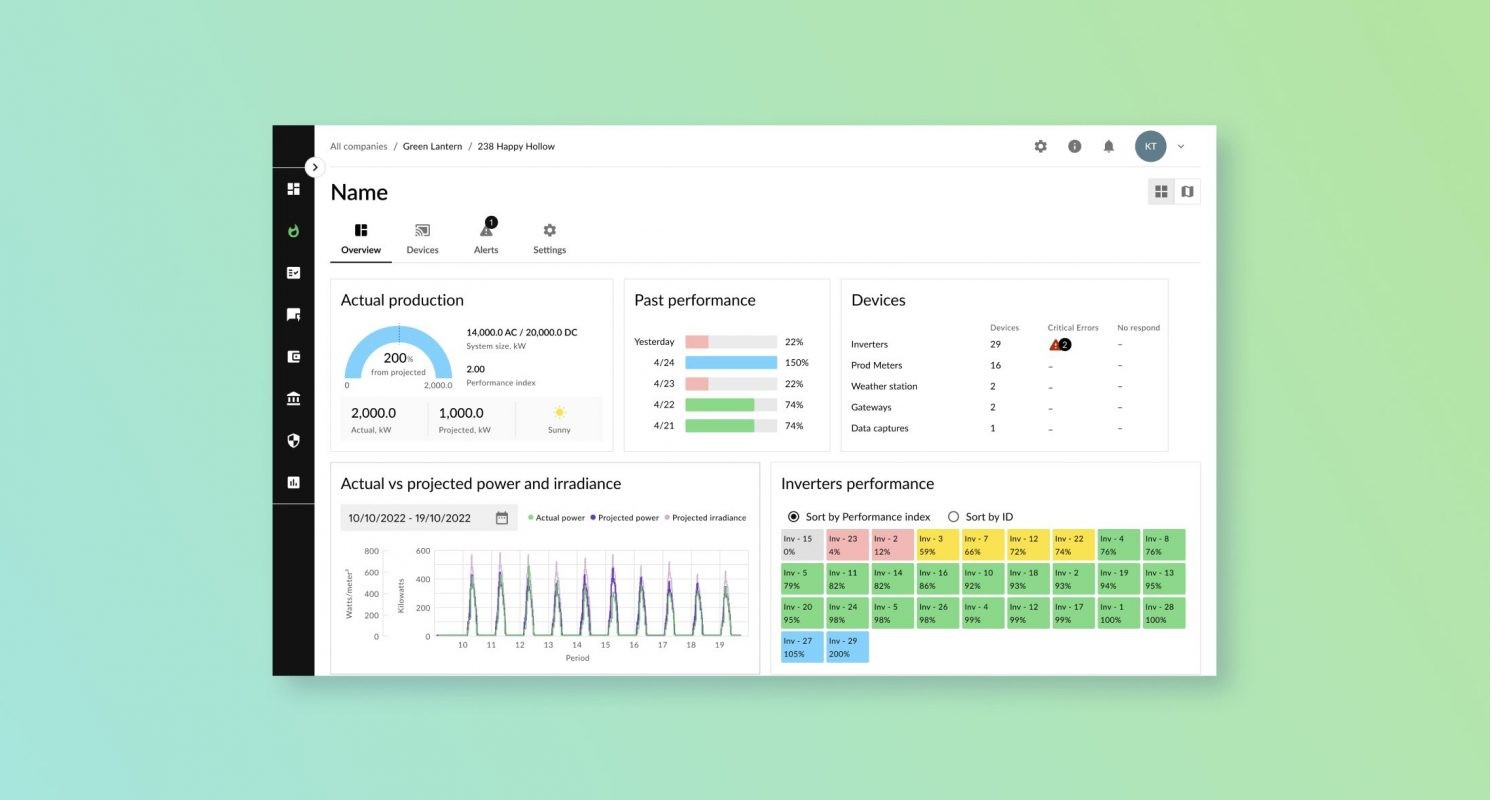
Overview.
Modular system and its functionality
Our system became the central point for keeping all solar field data. Users could easily switch the focus from one module to another. For example, access task assignments from the system alerts, see how performance metrics affect the revenue, and seamlessly switch between the projects.

Asset management
Inventory database management and assets tracking, which helps to stay updated on the status of each asset, configure cost and depreciation details, and automate periodic maintenance of the assets.

Task tracker
Tracking, management, and connection projects’ work breakdown across the teams. Communication and collaboration between participants via tickets. Customization of ticket templates depending on the documentation, construction, financing, or operation and maintenance pipelines.

Document repository
Documents storage and management, permissions management, documentation pipeline and schedule maintenance for the projects, due diligence management, document preview, and amendments tracking.

Finance
Invoicing and payment management for energy off-takers, profit and loss calculation and analysis, budgeting and payment tracking, financial reporting, and integration with the account management system.

Network administration
Connection of field devices and internet of things (IoT) components to the data acquisition system. Hardware operation, maintenance, and health data monitoring and visualization of the alerts.

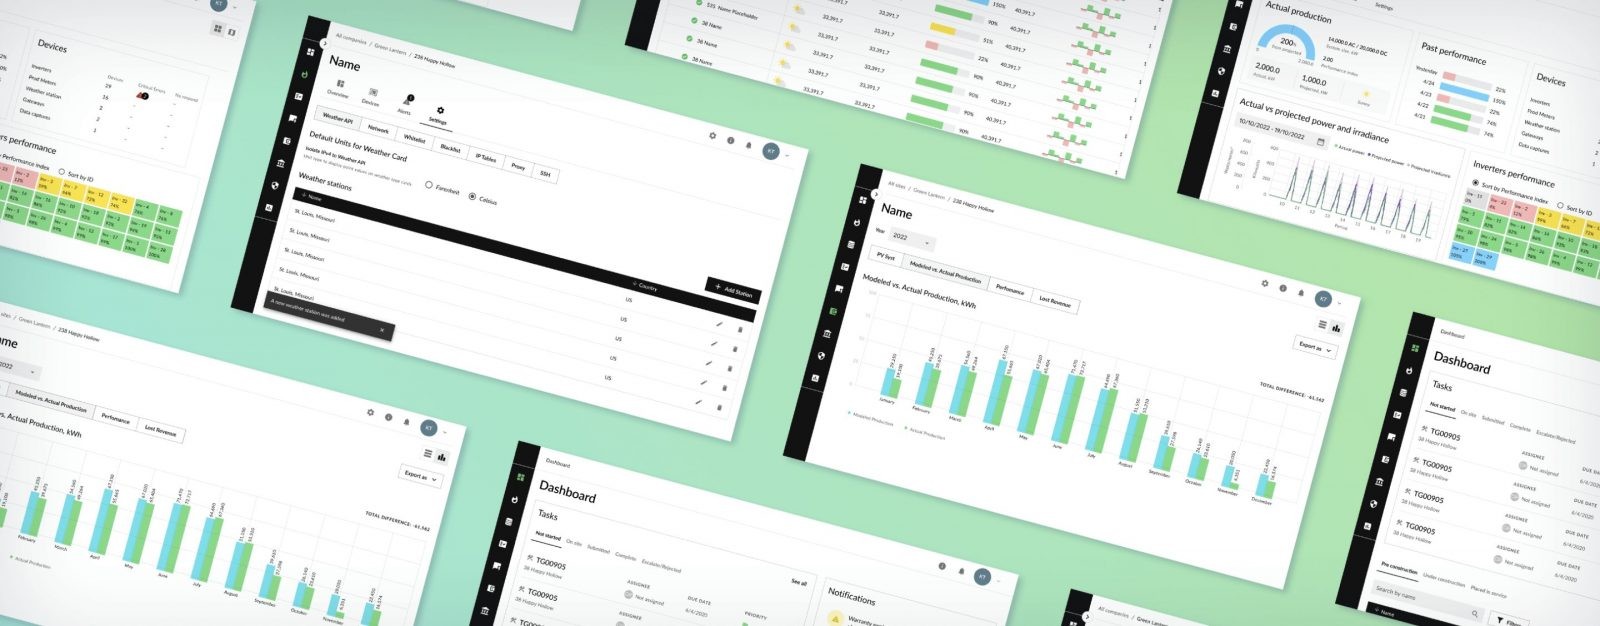
Monitoring of energy production
Data acquisition from electricity meters and visualization of energy production data as customizable dashboards. Calculation of energy production KPIs. Comparison of actual and expected energy production and highlighting the reasons if the production level is lower than expected.
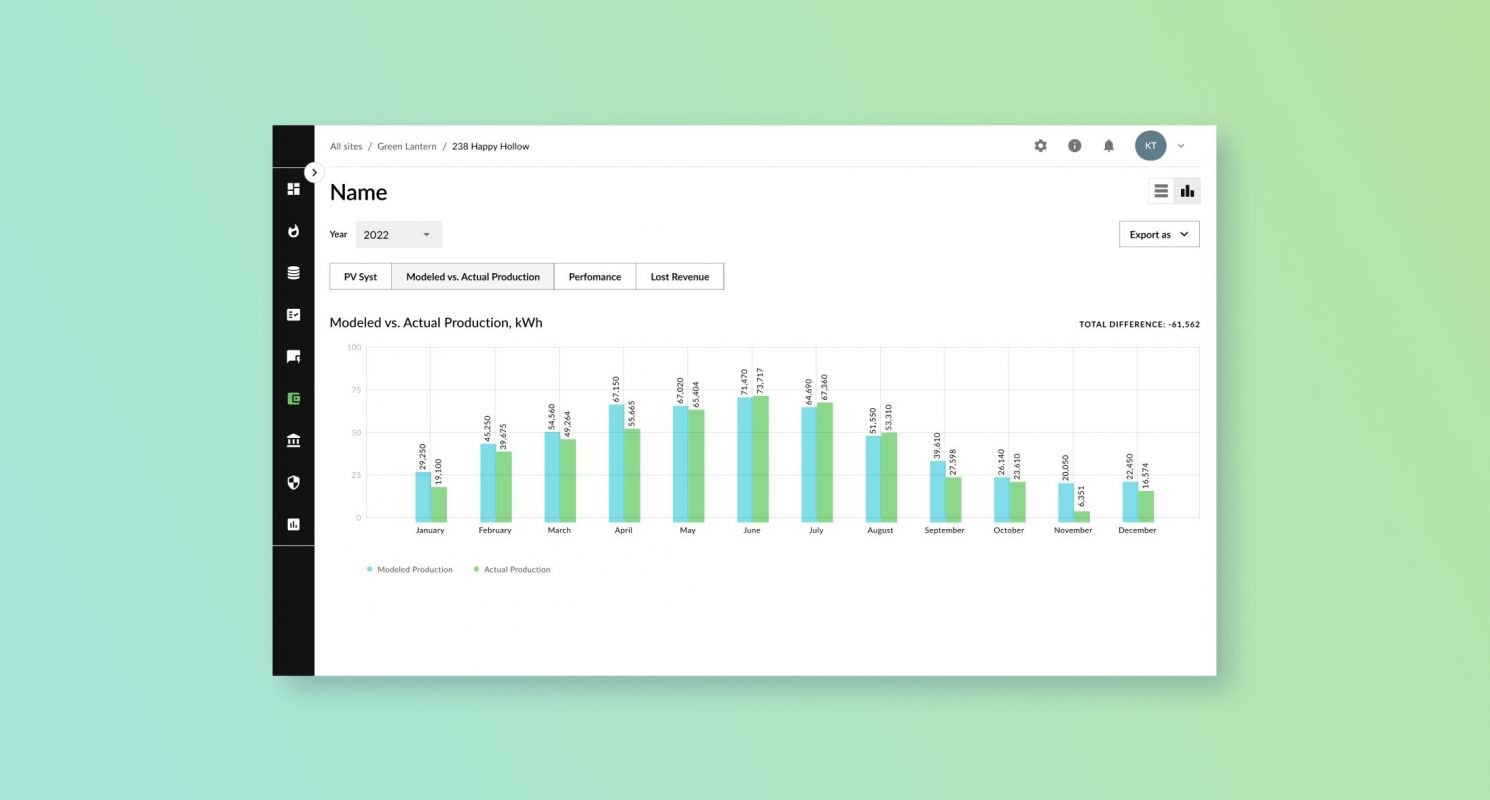
Modeled vs Actual Production.
OUTCOME
Outcome
During the private beta launch, the product had up to 1000 active users: Asset Managers, Developers, Investors, and O&M Providers. Each group shared detailed feedback, which helped us shape some of the features, but overall, we got assured our hypotheses were correct.
Also, this allowed our client from the start to sign for partnerships with several significant solar industry players.
Currently, we are working on the second product interaction, which involves the refinement of integrations and a public launch.
Read More
Explore articles from Artkai - we have lots of stories to tell
Join us to do the best work of your life
Together we advance the human experience through design.